Can satellite data inform siting of shellfish farms?
This post was written by Jordan Snyder, a graduate student in Damian Brady’s lab at the Darling Marine Center. This project is funded by NOAA Sea Grant’s National Strategic Initiative in Aquaculture.
The ultimate goal of my project is to provide aquaculturists with a reliable tool to help select ideal sites for new shellfish farms along the coast of Maine. Currently, the method for selecting a site suitable for growing bivalves (oysters, mussels, clams) is largely based on imitation and trial and error. This method is impractical because specific temperature, turbidity (i.e. water clarity), and chlorophyll conditions are necessary for shellfish to survive and grow in aquaculture. With the growing interest in aquaculture, a tool that accurately maps the physical and chemical characteristics within estuaries is a clear solution for site selection.
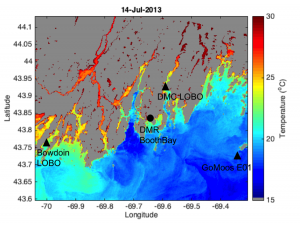
The data I’ve been using come from a satellite called Landsat 8, which captures a picture of Maine every two weeks and has been collecting measurements for the last three years. The satellite measures the amount of sunlight that reflects off the earth’s surface and travels back through space. After a series of processing techniques, we can use the pictures and information from the satellite to measure different physical characteristics on the Earth’s surface. The figure at left shows a snapshot of sea surface temperature. Triangles and circles indicate buoys and dock locations with temperature measurements for in situ validations. Resolution is 100 square meters per pixel.
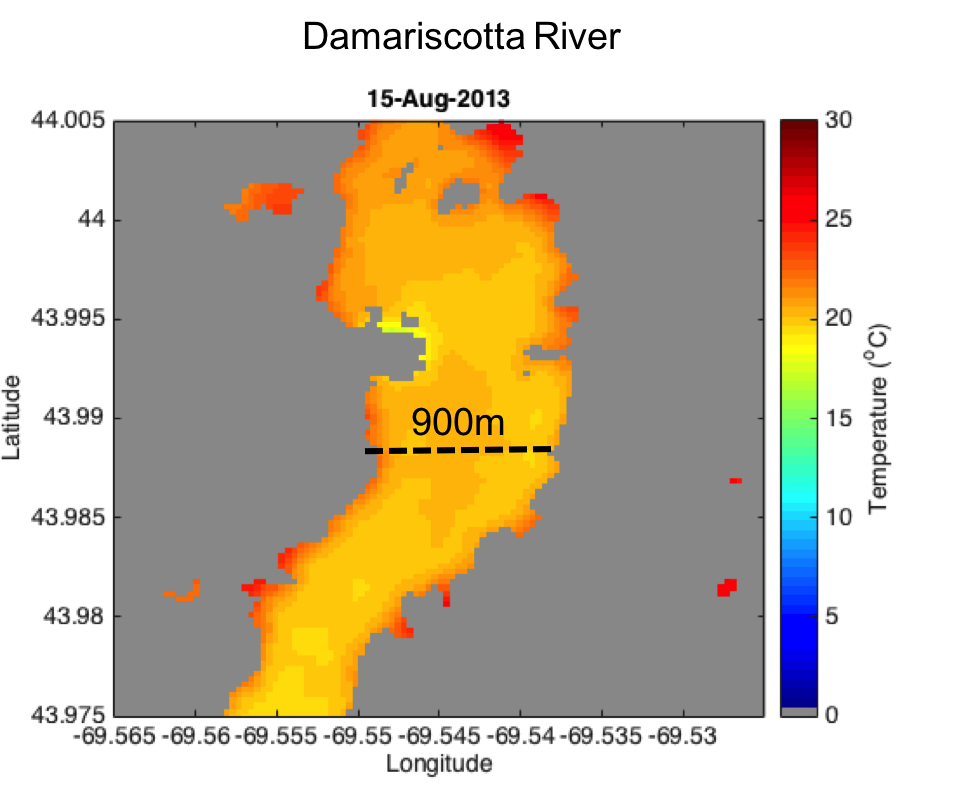
These characteristics include temperature, turbidity, and chlorophyll, which can be included in maps to identify areas that would be good sites to start an aquaculture farm. The information is particularly helpful because of the fine-scale resolution: measurements for temperature are made every 100 meters, and every 60 meters for turbidity. An example of Sea Surface Temperature outputs for the Damariscotta River provides a sense of the visuals, and the resolution (900 meter transect shown for scale.)
My research involves tailoring the data coming from the Landsat 8 satellite to fit the unique coastline and estuary systems of Maine. Because some estuaries are quite shallow, narrow, or close to land, the data from the satellite requires special processing. Initial tests of the satellite data are being done in the Damariscotta River, where scientific buoys are collecting similar data at very high precision. We can compare the data from the buoys to ensure the accuracy of the satellite measurements, as well as learn more about the Damariscotta River, an estuary that has several prosperous aquaculture establishments. If successful, the imaging techniques that result from this project can be useful for other applications in marine coastal environments including water quality monitoring, ecosystem management, and aquaculture along the coast of Maine.