Science to help achieve intersecting goals of a fishery and coastal wildlife
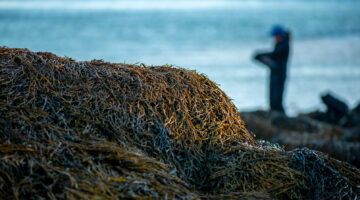
Figure 1: Diagram representing rockweed food-web survey during high and low tide for Objective 1. The circled numbers represent different measuring protocols: (1) Rockweed architecture and biomass; (2) Invertebrate communities at mid and low tide; (3) Bird communities; (4) Fecal DNA barcoding of birds; (5) Autonomous sensors measuring abiotic variables. Note: read more Science to help achieve intersecting goals of a fishery and coastal wildlife