How to Interpret a Beach Profile Graph
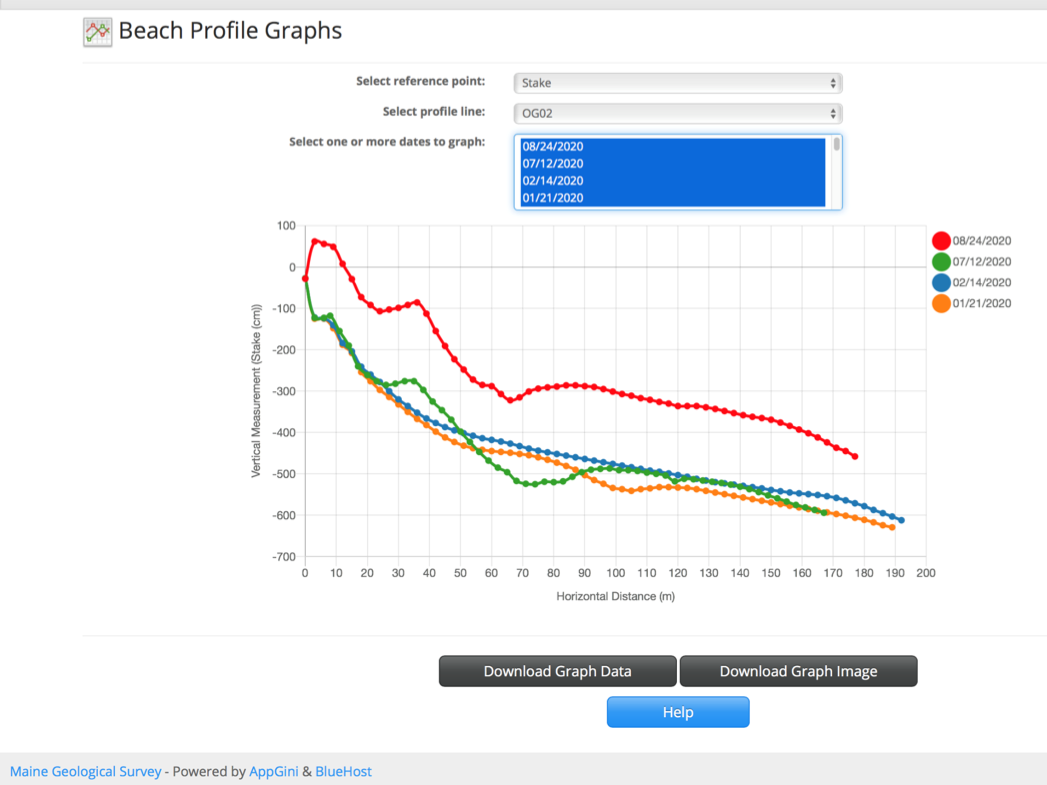
Using the simple feature on MGS Collects, you can make a graph of beach profile data you select. But before graphing your data, here’s an overview of how to read and understand the graph. This is an example of what a graph looks like:
THE PROFILE
This graph of Ogunquit Beach in Ogunquit (OG), profile line number 2 (02) is comparing the condition of the profile in two winter months (January and February) and two summer months (July and August) in 2020. The data points collected on the beach are all represented here by colored dots. Connecting these dots produces a colored profile line for each month.
THE MEASUREMENTS
Vertical Measurement (Stake (cm))
When looking at the graph, the vertical change in elevation from the beginning to the end of the profile line (from left to right on the graph) is measured in centimeters (the vertical line on the left). The “Stake” is the marker on the beach that indicates the start of the profile line. Because this profile, OG02, is generally lower at right side of the graph compared to the left side, most of the centimeter measurements are going down, represented by negative (-) numbers, below zero. However, you can see that in August (the red line), the profile line goes up from the starting point, in which case, the measurements are represented by positive (+) numbers.
Horizontal Distance (M)
The horizontal distance from the beginning (at the Stake) to the end of the profile line is measured in meters (the line that runs on the bottom of the graph). Typically, each data point consists of a 3-meter measurement, though this may vary among different profiles and beaches.
A note on these different units
Because the graph’s measurement units (cm and M) are not the same, the resulting slope is exaggerated making the profile lines look more like ski slopes, than gently sloping beaches. But this graphic approach is necessary in order to be able to view the data on a standard sized page.
THE RESULT
To read the graph, look at the lines in relation to each other. This graph shows us that these Ogunquit profiles in January, February, and July were similar, while in August the beach profile gained a tremendous volume of sand.
THE FINE PRINT
The graphs generated here represent snapshots of a particular profile at a particular time and do not represent long-term trends. Beach management decisions should be guided by a professional and not be based on this data alone.
THE METHOD
Please note: The data used to generate graphs is collected by trained volunteers using a relatively simple method for obtaining beach profile shapes and its quality is checked by program staff. However, this method has some inherent inaccuracies, including but not limited to:
-
- dependence on an accurate starting point;
- the visibility of the horizon during a survey;
- horizontal or vertical measurement errors made during data collection;
- data recording errors;
- and beach conditions on the day of the survey, amongst others.
THE INTERPRETATION
Comparing different dates at the same beach profile location can provide a good, qualitative, indication of horizontal and vertical changes of the beach or dune observed at that particular beach profile over time. However, data viewers should note:
-
- a recorded beach profile only represents the shape of the beach at the time of measurement (it is a snapshot);
- subsequent tides, currents, waves, or storms may change the shape of the beach dramatically from day-to-day;
- short-term (i.e., monthly) changes observed at a beach profile location do not necessarily represent a long-term (seasonal, annual, or decadal) trends;
- changes observed at a specific profile location do not necessarily represent overall changes at an entire beach;
- at a few locations the profile starting point has changed over time; this can lead to some graphs showing unusually large offsets of the profiles that do not represent beach erosion or accretion;
- recorded beach profile data should not be the only source of data used to determine beach management actions;
- and analysis or interpretation of beach profile data should be conducted by a professional.
The Maine Geological Survey has analyzed and interpreted beach profiling data to highlight important trends which are captured in the biennial State of Maine’s Beaches reports below.
- State of Maine’s Beaches in 2019
- State of Maine’s Beaches in 2017
- State of Maine’s Beaches in 2015
- State of Maine’s Beaches in 2013
- State of Maine’s Beaches in 2011
- State of Maine’s Beaches in 2009
- State of Maine’s Beaches in 2007
Now that you can read a graph, click here to learn how to graph beach profiles